
Boring News... Oregon Case Rates by County Track Vaccination Rates.
Boring News... Oregon Case Rates by County Track Vaccination Rates.
Sooooo last month.

KOIN news reported on a list compiled by Stacker of the counties with highest COVID-19 infection rates in Oregon using data from the U.S. Department of Health & Human Services and vaccination data from Covid Act Now.
Interesting, though, the highest case rates were observed in Oregon counties with the highest vaccination rates.
Are you bored yet?

But, wait, there’s more! The KOIN news piece still mentioned vaccination (evidentally, the KOIN news team has yet to become bored), and alluded to as successful:
The vaccine deployment in December 2020 signaled a turning point in the COVID-19 pandemic. By the end of May 2021, 40% of the U.S. population was fully vaccinated. But as vaccination rates lagged over the summer, new surges of COVID-19 came, including Delta in the summer of 2021, and now the Omicron variant, which compriss the majority of cases in the U.S.
And….
The United States as of May 18 reached over 1 million COVID-19-related deaths and 83.4 million COVID-19 cases, according to Johns Hopkins University. Currently, 66.5% of the population is fully vaccinated, and 46.4% of vaccinated people have received booster doses.
What is notably missing from this KOIN article is something easily ascertainable. At this point in time, there is a direct relationship correlating counties with high vaccination rates to higher CoVid case rates. This correlation suggests not only that vaccines are failing, but the effect of vaccination tends to the negative.
Using KOIN’s published data:
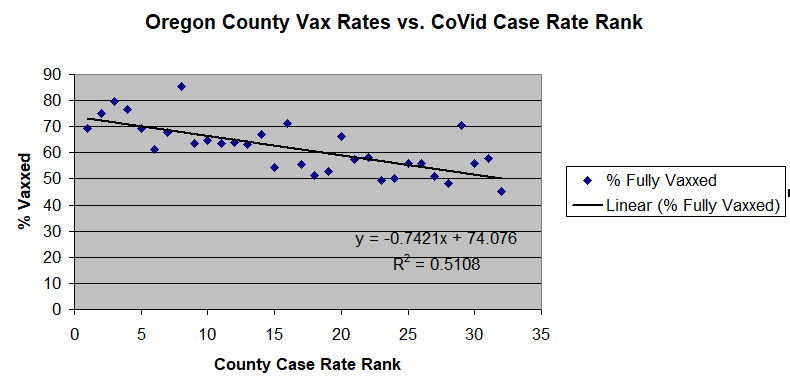
Oregon counties with the lowest vaccination rates appear to be at the lowest risk of CoVid infection. In the above chart, the four Oregon counties with populations lower than 10k were removed, because of the relatively small denomonator; one CoVid case drastically effects case rates and therefore rank, but this deletion made little difference (prior to removing these four counties, R-squared for this regression was .49).
Just in case anyone wonders how this might translate into CoVid case rates…
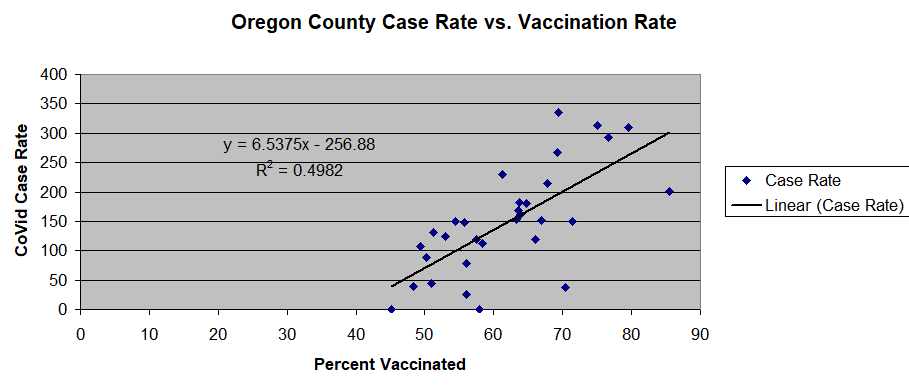
Again, the four counties with populations less than 10,000 were removed, but again, this didn’t make much difference, as R-squared remained at .49 before removal.
I have been following Oregon data for almost two years now. I haven’t calculated any relationship (mask compliance, population mobility, mitigation efforts, vaccine uptake, population, etc.) this close to a direct relationship. I found a statistically significant correlation of air quality by county to Oregon county case loads (measured in terms of CoVid categorized hospitalizations and bad outcomes) in September 2021 (when Oregon had a lot of wildfires with air quality variance between counties at staggering divides). But the correlation I’m writing about herein is tighter.
It’s as if they can’t print an article talking about mortality without doing the usual script regarding vaccines. Even to just remind everyone they’re still calling them ‘vaccines’.
It's a real head scratcher that folks still imagine jabs work with epic failure in their face. good on everyone who keeps up with the numbers. To riff on the wildfire comment its as if there is smoke filled rooms and nobody thinks there may be fire. Humans are odd.