
Vixen (just tried to make this one interesting)
Vixen (just tried to make this one interesting)
Sorry to anyone who gets an email on this, if you subscribed, a warning: this may be boring if you are not interested in financial markets.


Someone who I consider close to me (as in more than an acquaintance, less then family and close friends, but someone I would defend with all I have), asked about implied volatility in the options markets. I think, I might, know something about that, so I wanted to spend some time on it. My friend has spent much of his time giving to others, so I am motivated to share what I know through my experience of options trading - dating back two decades.
I’m only going to focus on implied volatility in the option market, in general. The best way to measure implied volatility in the broader markets is through VIX.
While the formula is mathematically complex, it theoretically works as follows: It estimates the expected volatility of the S&P 500 Index by aggregating the weighted prices of multiple SPX puts and calls over a wide range of strike prices.4 All such qualifying options should have valid nonzero bid and ask prices that represent the market perception of which options’ strike prices will be hit by the underlying stocks during the remaining time to expiry.
Definitions of VIX kinda’ suck. It never works. It never can really be applied as an estimate something (much like CoVid statistics given to us by health authorities). VIX doesn’t even represent theo in S and P indices, like /ES, SPX and SPY. But VIX as a picture works, as in a piece of art, works. And for goodness sake, do not ever attempt to trade it (as in “be sure to wear sunscreen”). Trading VIX can be done successfully, but the time and effort placed into learning the nuances isn’t worth it, unless one is only interested in the art.
Much as the broader stock market is art, as in a picture. painted — the best explanation ever given to me is it is painted in brushes of human interaction with nature, the worse is it is painted in algorithms. Back to VIX.
I have watched VIX for years. It’s numbers don’t match it’s definitions. For example today, SPY reached a new low.

But VIX chilled (while S&P was tanking) - as an everyday options trader, I can vouch, theo didn’t match VIX.
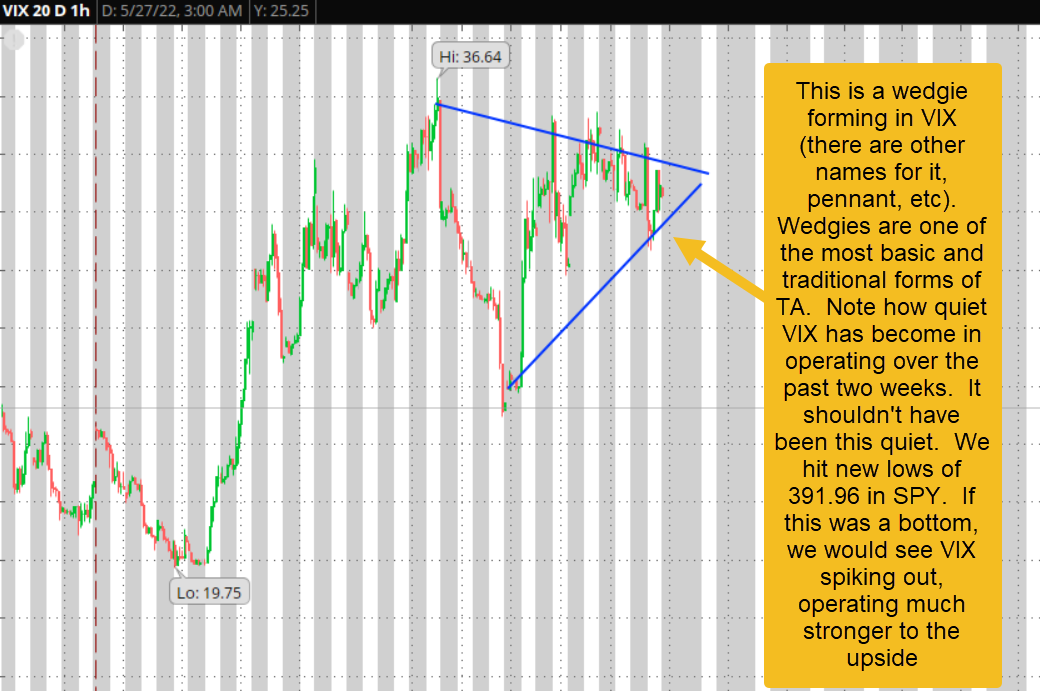
I have never used VIX as a technical target. It has rarely proven to be on-the-money, but it is a good proximal indicator. So w/o sharing more boring charts, I’ll go through the technical analysis of VIX. Mind you, it will not be exact, as TA on other charts most often is, but it will be proximal. Also in terms of market psychology, which is not IMHO market fundementals, it is obvious the bulls don’t give a damn. They need to fear enough to pay the high premiums in put options to protect and hedge. They don’t care enough to pay those premiums. This is what VIX, I guess is fundamentally telling us. But I don’t care about fundamentals; I’ve always only been interested in the pretty pictures.
Pretty picture number one:
